
Unleashing the Power of Data Analysis with STATA
A Practical Guide for Efficient Decision-Making


In today's digital era, data has become an essential requirement for businesses in both public and private sectors. Regardless of the industry, data plays a crucial role either indirectly, influencing decision-making, or directly, being analyzed to extract insights. Data analysis is a powerful tool that enables organizations to optimize inventory management, forecast demand trends, analyze purchasing patterns, and enhance supply chain efficiency.
However, the main challenge for most organizations lies not in the lack of data, but rather in the lack of skills required to extract valuable insights from it. Data analysis, also known as data analytics, refers to the process of arranging, explaining, and presenting data to draw meaningful conclusions. It involves inspecting, cleaning, and transforming data to obtain valuable information.
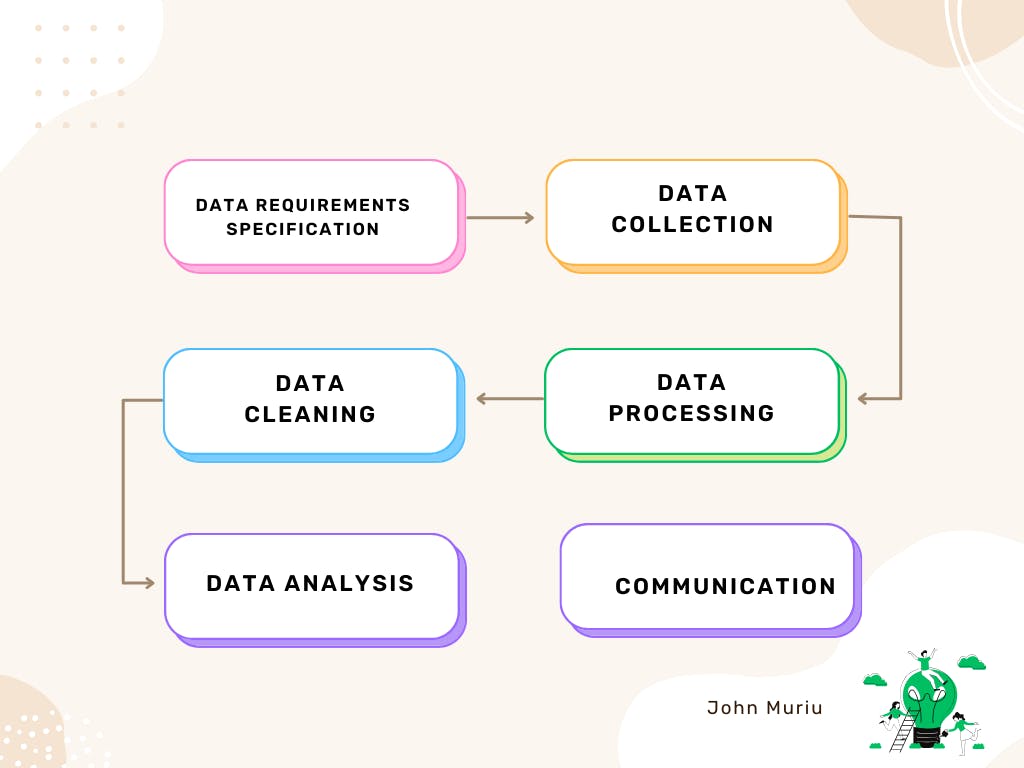
To effectively learn from data, it is important to ensure that the data aligns with your specific questions, draw accurate conclusions, and use data that informs decision-making. The data analysis process consists of various phases, including data collection, data processing, data cleaning, analysis, and communication.
Before embarking on a data analysis project, it is essential to be familiar with the range of tools available. There are numerous tools, such as R, SPSS, Python, MS Excel, and STATA, each offering specific features for different data tasks. The choice of tool depends on factors such as the volume of data, intended tasks, features required, compatibility, flexibility, and available funds. SPSS and STATA require specialized licenses, while Excel can be accessed through Microsoft or the online version known as Google Sheets. R and Python are open-source software that can be freely accessed.
Introduction to STATA
In this tutorial, we will focus on introducing participants to STATA, a powerful statistical software commonly used by researchers in economics, biomedicine, and political science. STATA allows users to analyze, manage, and visualize data through both command-line and graphical user interfaces, making it user-friendly.
Here are some basic aspects to know about STATA:
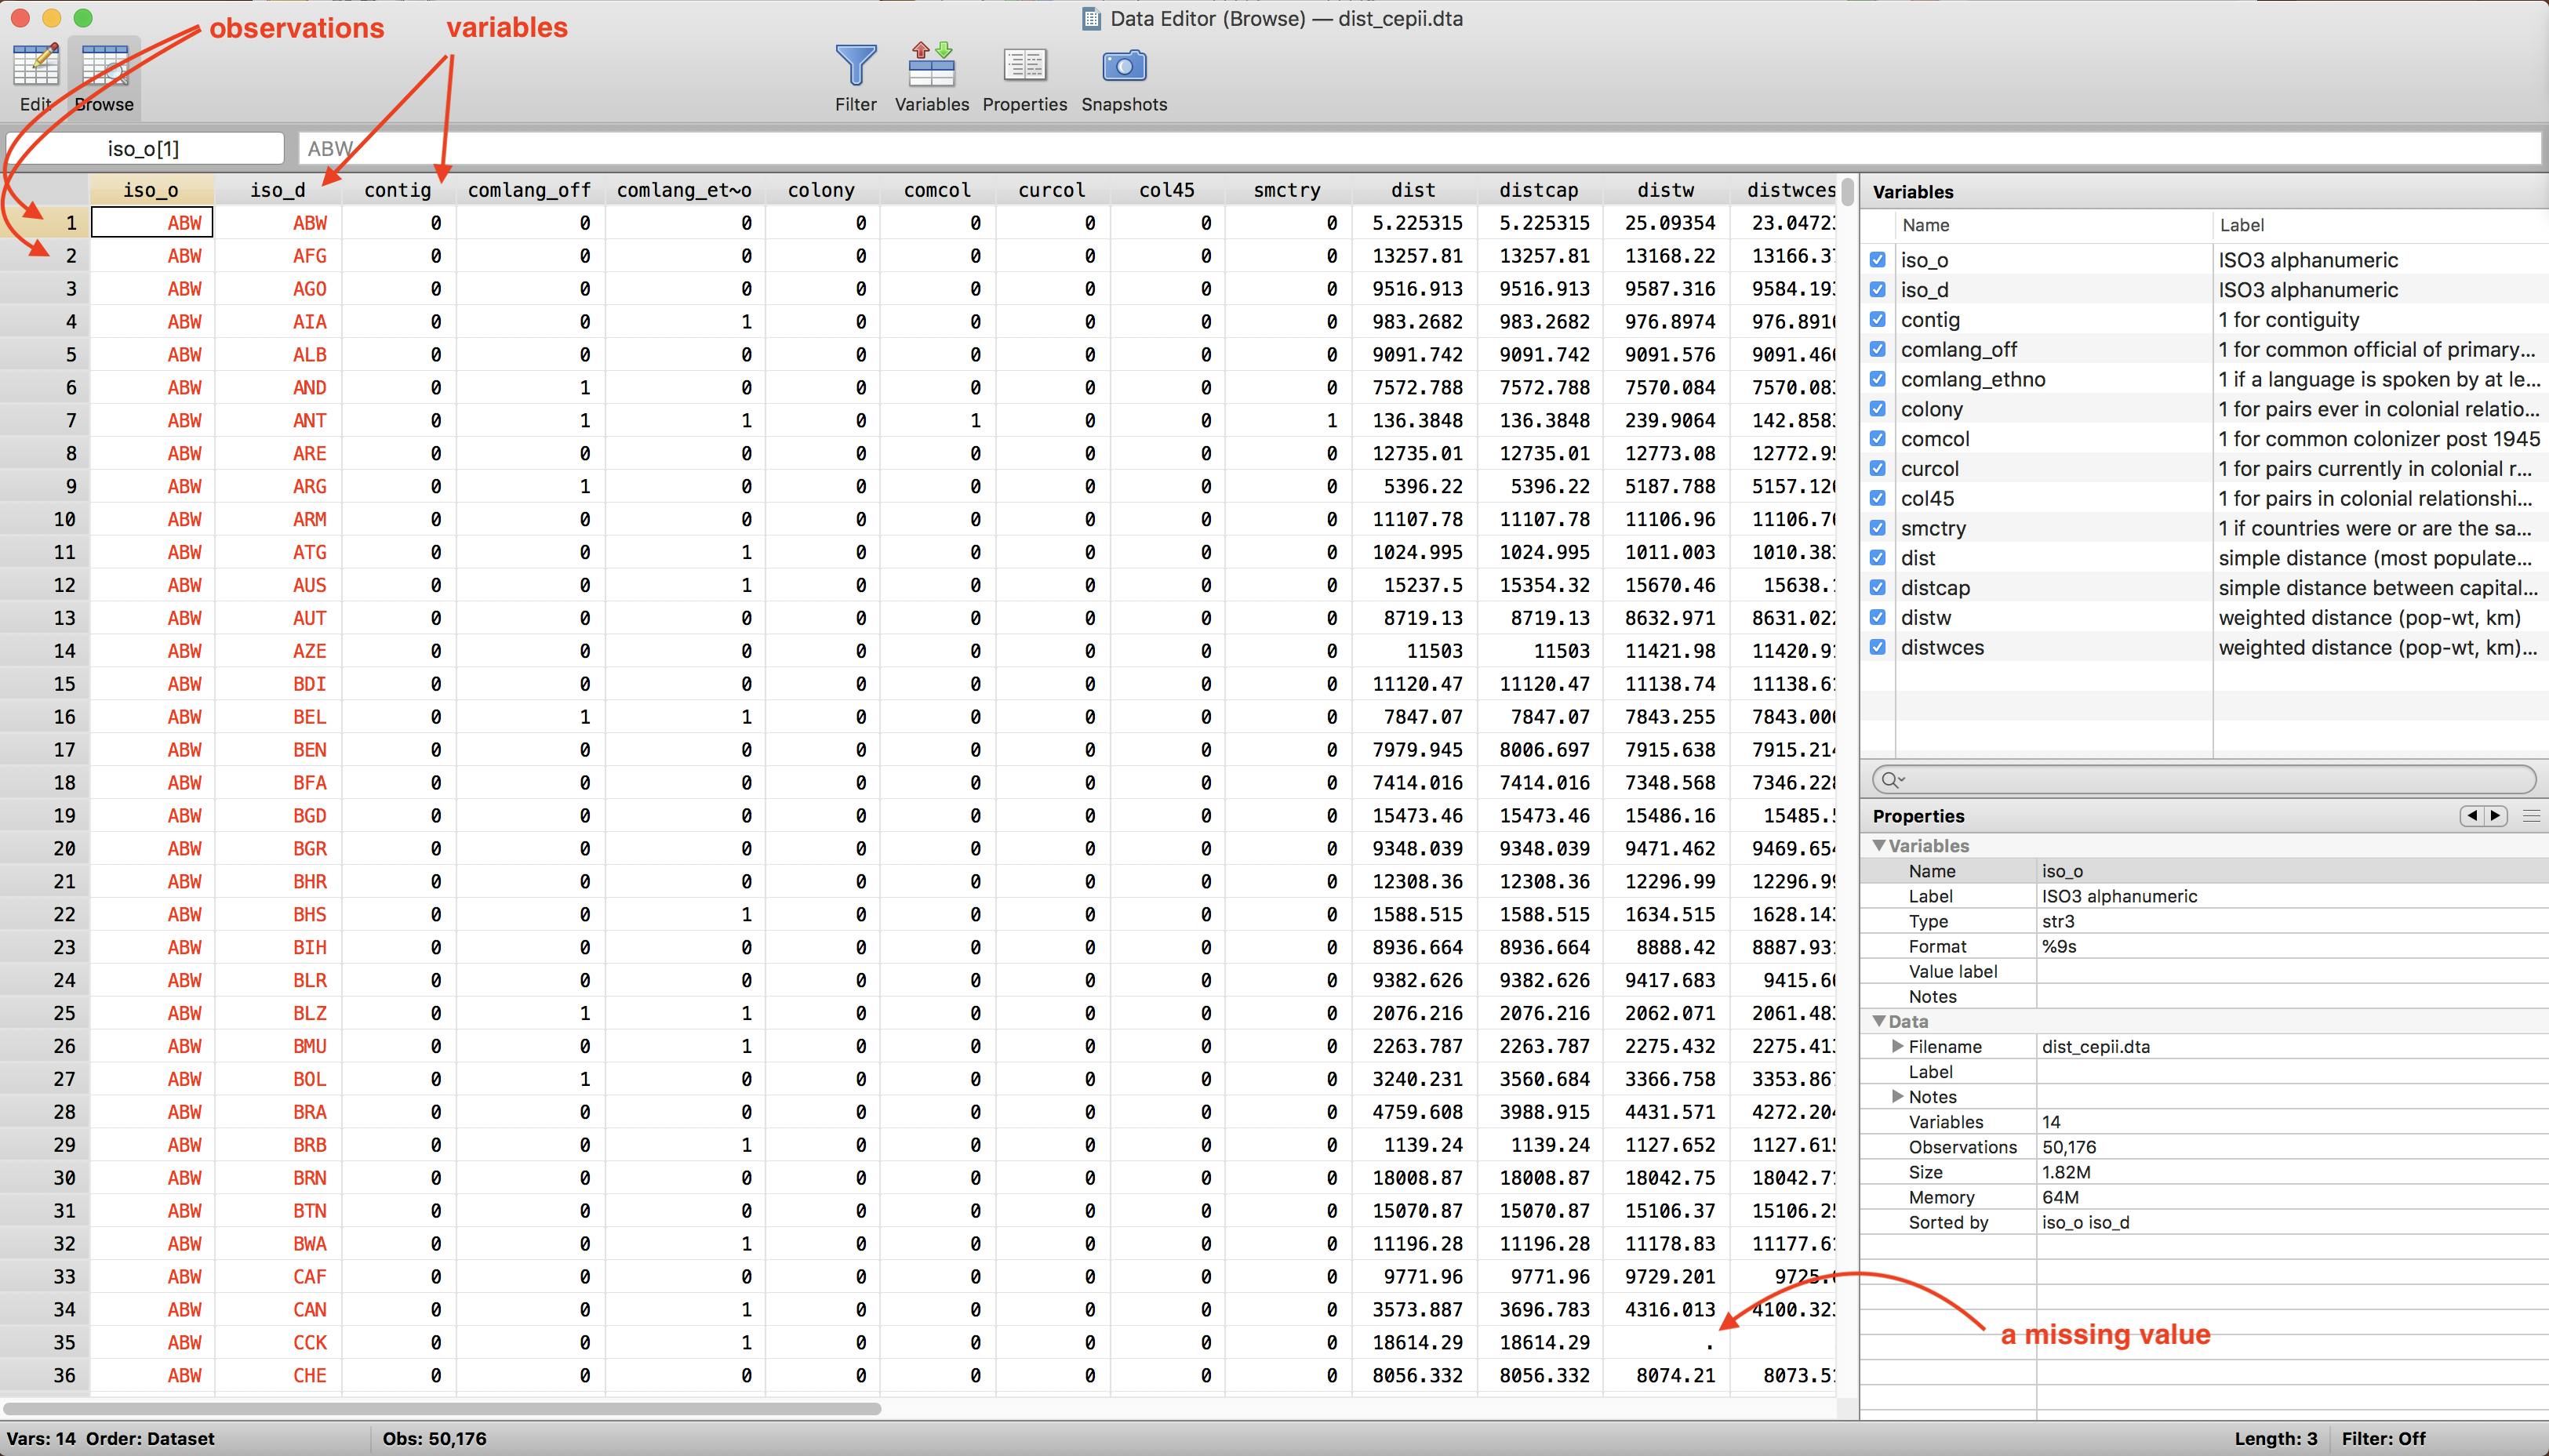
Reading Stata Format (.dta) Data Files: Stata data files have the extension .dta.
Importing Excel or Text Data Files into Stata: To import an Excel file, go to File, then Import, and select Excel spreadsheet. Browse for the data file and ensure to import the first row as variable names if applicable.
Saving a Dataset in Stata Format: It is recommended to save modified datasets as new files instead of overwriting the original data. This allows for easy retrieval in case of errors or the need to start afresh.
Recording and Labeling Variables: Recording variables can be useful for aggregating categories, changing category order, or converting quantitative variables into categorical ones.
Creating a "Do" File in Stata: A do file is a separate file with a .do extension that lists and executes Stata commands. It offers a convenient and efficient way to replicate, modify, or repeat analyzes, as well as correct errors.
By following these guidelines, you can effectively utilize STATA for data analysis purposes.